
Home / Look-back chart
Look-back chart for the listing prices you recorded
Enter what you saw, on the days you saw it, for one version of one listing. The chart draws the record and lays the two reference lines over it. Nothing you type leaves this page.
Plot one listing against both references
- your prices
- 7-day low
- 30-day low
- crossed-out figure
Filling in the chart
This is how to use the tool for a single find. Pick one listing and one version of it, the size and colour you would actually buy. Each time you look at the listing, add a line with the date and the large current price in yuan. Three or four rows over a couple of weeks are enough to start with; more rows make the thirty-day line steadier.
In the second box, give the date the reduced price started. If the listing shows a campaign start time, use that; otherwise use the first day you saw the lower price. The reduced price is optional, because the chart takes the price recorded on the start date if you leave it empty. Add the crossed-out figure and the percentage the page claims if it shows them.
The chart redraws as you type. The practice record loaded at first is invented, so clear it before you enter your own. The page keeps nothing: close the tab and the record is gone, so copy it somewhere if you want it later.
What the two reference lines stand for
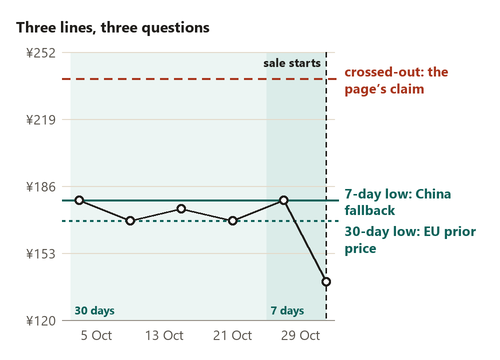
The solid green line is the lowest price you recorded in the seven days before the start date. It stands in for the base in China’s rule on promotions, which is the lowest transaction price in that window. You record displayed prices, so the line is an approximation of that base: usually close, and never lower than what was on show. If you recorded nothing in those seven days, the chart uses the last price you saw before the start, which mirrors the rule’s own fallback.
The dotted green line is the lowest price you recorded in the thirty days before. That is the European prior price in Article 6a, and close to the period the British regulator says a reference price should usually be held for. The dashed red line is the crossed-out figure. The read-out under the chart works out the reduction against each line and against the crossed-out figure, so you can see how much of the claimed saving survives each test.
Shapes the chart can point out
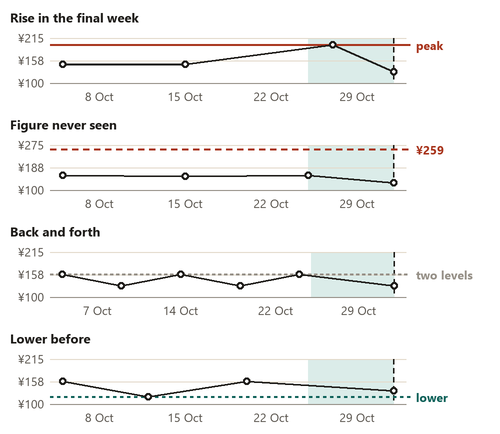
Under the numbers, the read-out adds plain observations about your record when it sees one of these shapes. They follow the examples regulators give of comparison prices that tend to mislead:
- A rise in the final week. The highest price in the thirty days appears only in the seven days before the sale.
- A figure never seen. The crossed-out figure is not among any price you recorded before the start.
- Back and forth. The record moves between two or three prices again and again, so no level is clearly the usual one.
- Lower before. Somewhere in the thirty days you recorded a price below today’s reduced one.
- Thin record. Fewer than four prices fall in the thirty days, so the long line rests on little.
- Claim and arithmetic disagree. The percentage on the page does not match the crossed-out figure and the reduced price.
Where the chart stops
The chart knows only what you typed. It cannot see the seller’s sales, prices you missed between visits, or prices that applied only to some accounts. A gap of a week between two visits is a week the chart knows nothing about.
It also makes no judgement about anyone. A crossed-out figure above both lines tells you the saving is smaller than shown on the measures the rules use; it does not mean a seller broke a rule, and this site does not say so. Use the result to decide whether you still want the find at today’s price, and leave findings to regulators.
For the rules behind the lines, see the pages on China’s seven-day base and on the European and British yardsticks.
Images: catalogue photographs are category examples, not this site’s purchases or verified Mulebuy orders. Drawn material, dimension and lettering examples explain a concept; they do not certify the depicted product.